Projects
Personal projects across Python, SQL, Power BI, and Excel.
▶ Tap to play the video
Power BI
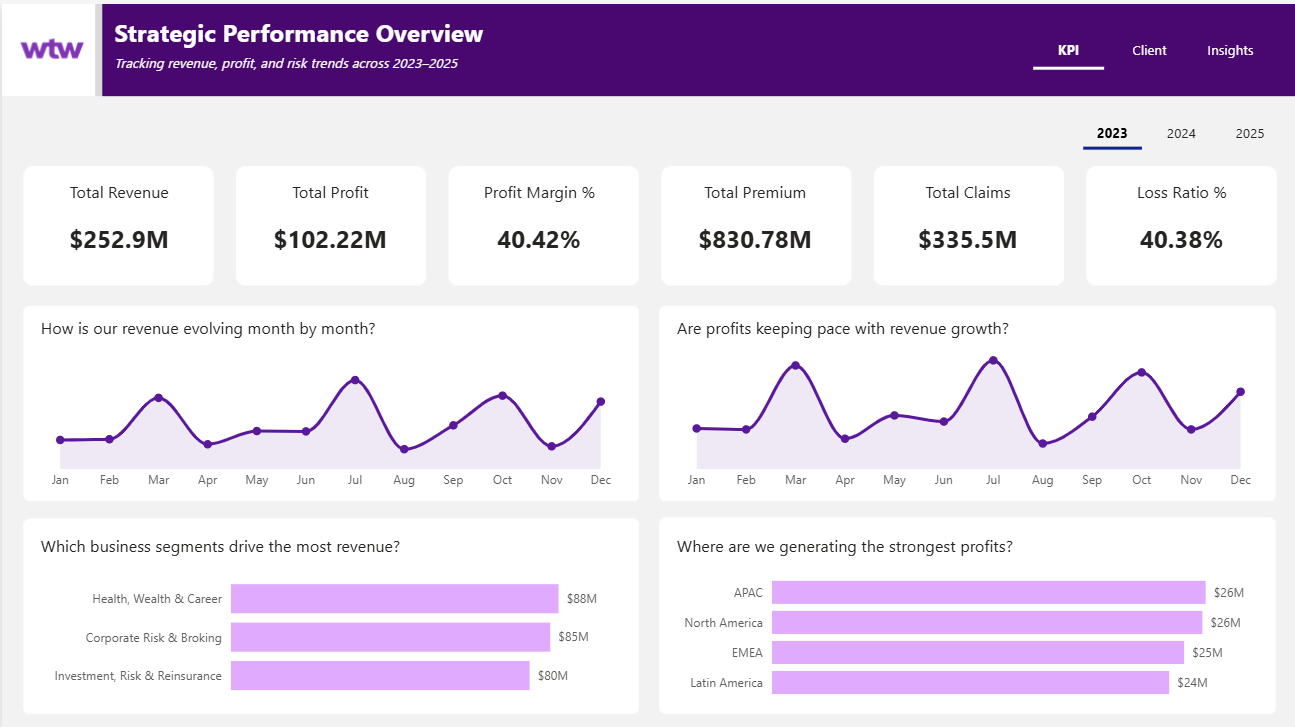
Insurance Performance Dashboard (2023–2025)
Developed a multi-page interactive Power BI dashboard simulating an insurance analytics environment using dummy data from 2023–2025.
The dashboard analyzes revenue, profit, premium, claims, and loss ratio trends, alongside client portfolio metrics such as renewal rate, satisfaction,
revenue per client, and risk scores. It highlights regional and business segment performance, identifies top revenue-generating clients, and provides
executive-level insights through KPI modeling, DAX measures, and data storytelling within a simulated insurance context.
▶ Tap to play the video
Power BI
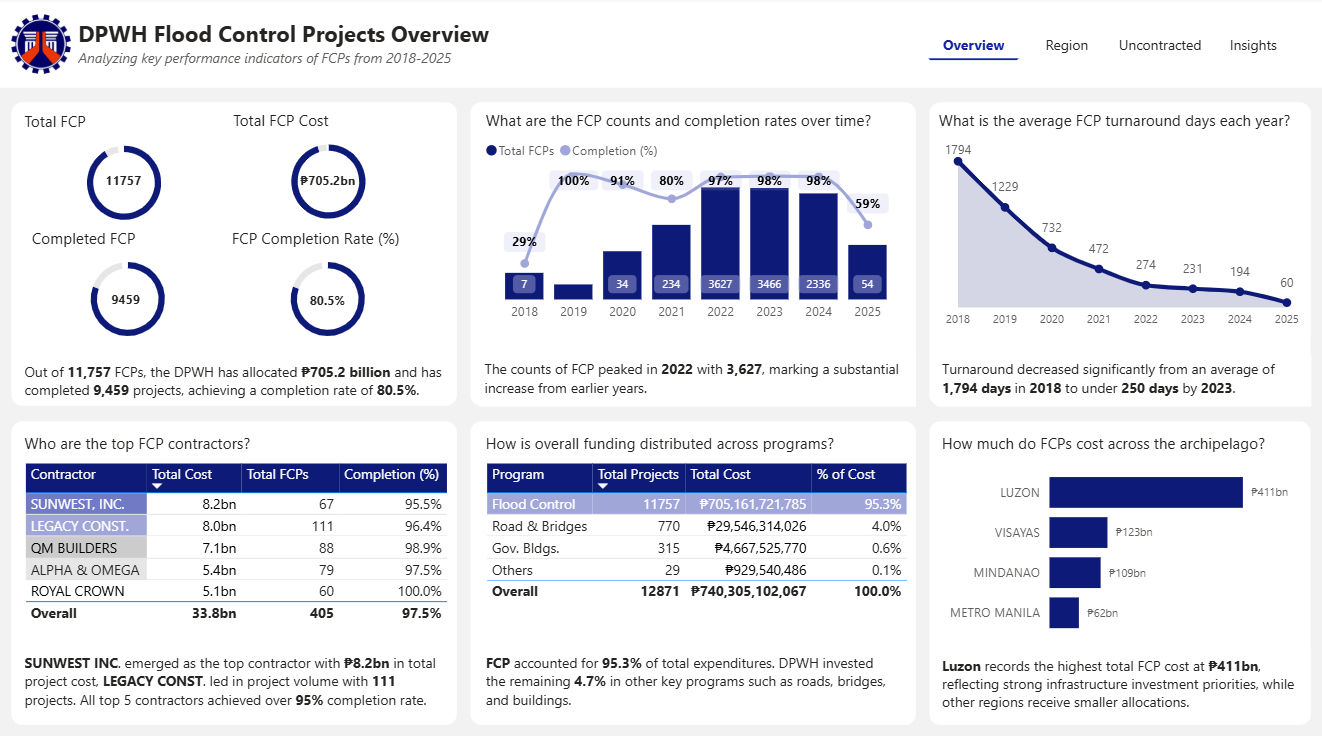
DWPH Flood Controls Dashboard
Placed Top 6 in the Power BI Pilipinas Contest by developing an interactive Power BI dashboard analyzing DPWH Flood Control Projects (2018–2025).
The dataset showed 11,757 projects worth ₱705.2B with an 80.5% completion rate, and turnaround time improving from 1,794 days to under 250 days.
Funding was highest in Region III, Region V, and NCR, while top contractors like SUNWEST INC. maintained 95%+ completion rates. Notably,
2,014 projects worth ₱162.5B had no assigned contractors, revealing key data gaps and oversight concerns.
▶ Tap to play the video
Power BI
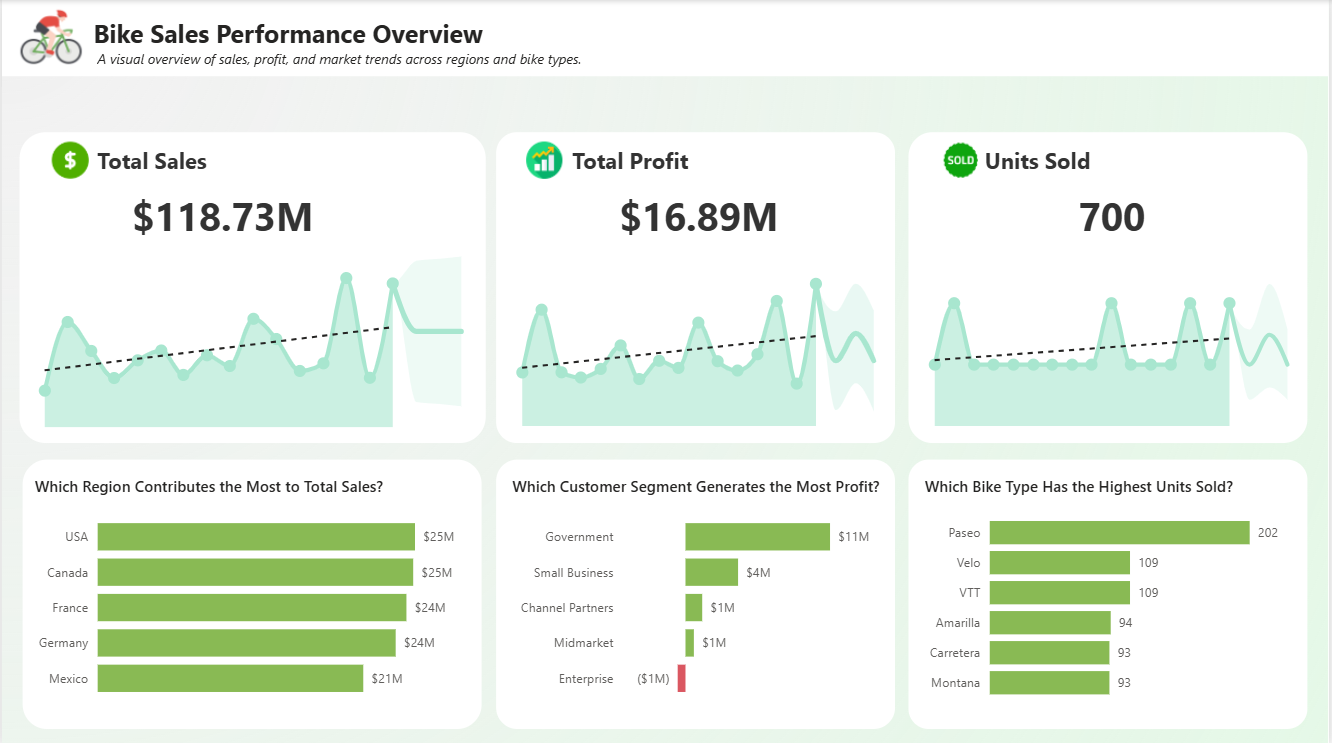
Bike Sales Performance Overview
Delivered insights on sales and profit performance across regions and bike types, revealing strong results in the Government
segment and a $1M loss in Enterprise. Identified a sales gap between regions and underperforming bike models. Recommended targeted
marketing, pricing adjustments, and inventory optimization to improve sales and profitability.
▶ Tap to play the video
Power BI
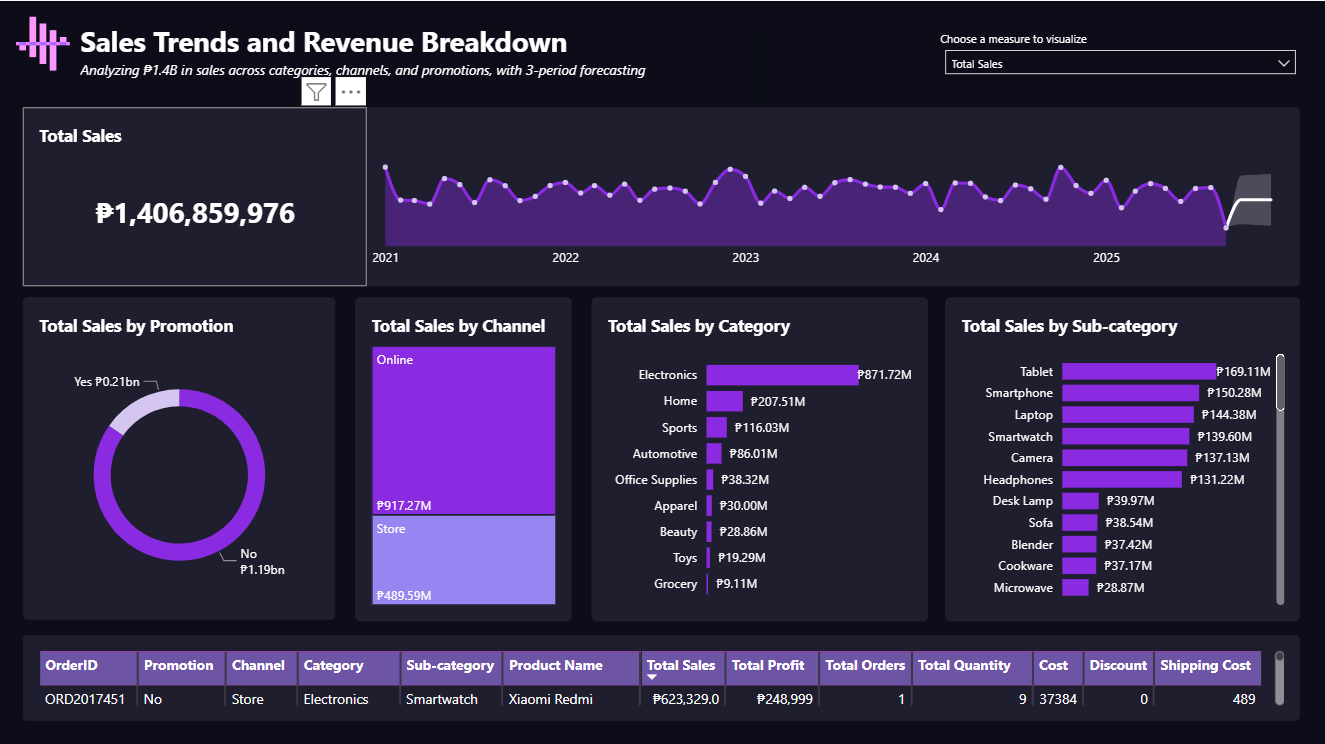
Sales Trends & Revenue Breakdown Dashboard
Delivered insights on revenue distribution, seasonal demand, and category performance, uncovering a 10–15% sales gap across product categories.
The dashboard highlighted underperforming segments and suggested strategies such as stronger promotions, pricing adjustments, and optimized inventory
planning to improve sales outcomes.
These findings can help businesses align marketing efforts with consumer demand and drive overall revenue growth.
▶ Tap to play the video
Power BI
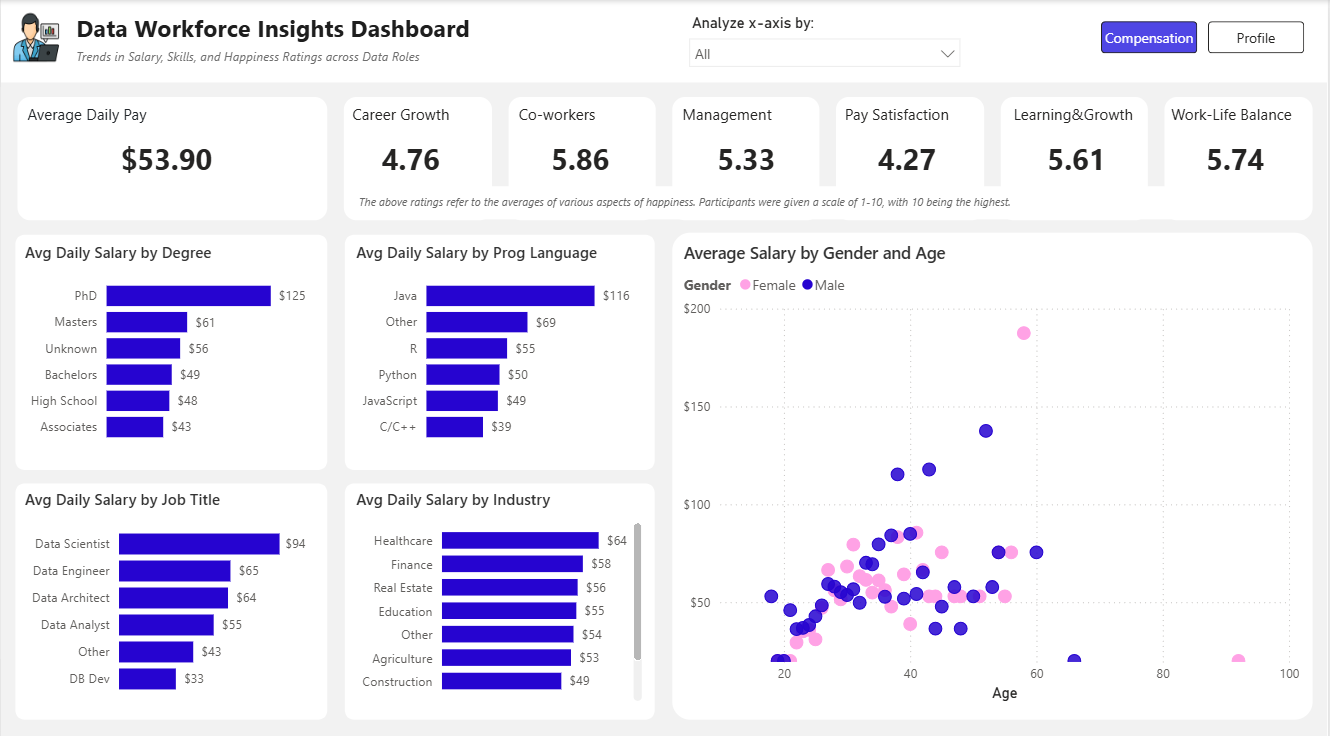
Career Trends and Workforce Insights in Data Professions
Developed an interactive Power BI dashboard analyzing compensation, career growth, and workforce demographics across data-related roles.
The insights revealed that professionals with PhDs earned the highest daily pay ($125), while Java specialists averaged $116 per day.
Data Scientists had the top salary among job titles at $94 per day. The workforce was predominantly male (74%), with most respondents aged 20–39.
Python emerged as the leading programming language (used by 67% of respondents), highlighting its strong influence in data-driven careers.
▶ Tap to play the video
Python
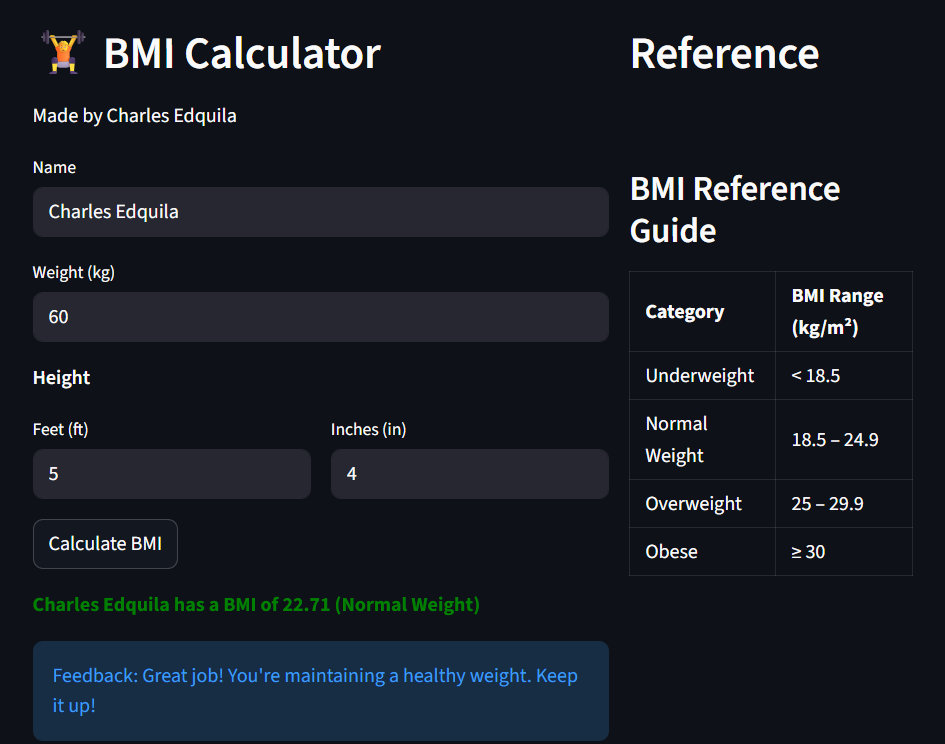
BMI Calculator Web App
An interactive web application built with Python and Streamlit that calculates Body Mass Index (BMI) from a user’s weight (kg) and height (ft/in).
It provides instant results with color-coded categories and personalized feedback, helping users easily understand their health status.
🔗 Website Link
Excel
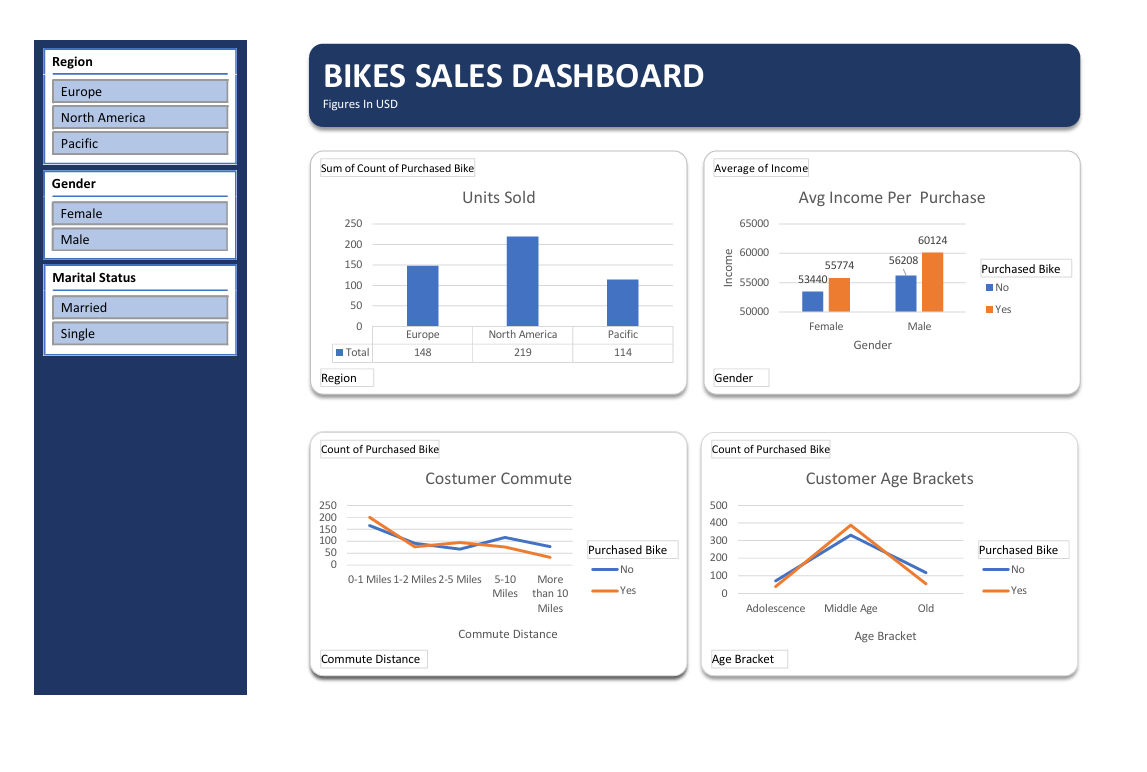
Bike Sales Performance Dashboard
This dashboard highlights bike sales across regions and demographics, showing that North America captured 45% of total sales, while Europe
(31%) and the Pacific (24%) trailed behind. Middle-aged customers drove the majority of purchases, with buyers earning $55K–$60K showing higher
conversion rates. To boost performance, businesses can strengthen promotions in
underperforming regions, target middle-aged demographics, and incentivize long-distance commuters to expand the customer base.
MySQL
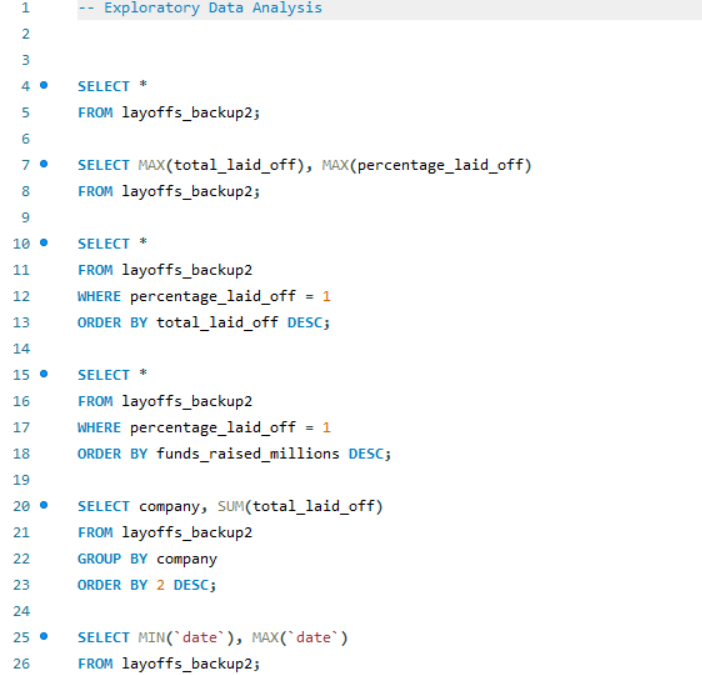
Exploratory Data Analysis – Company Layoffs
In this project, I analyzed layoff data from different industries using MySQL.
I created queries to find trends by country, industry, and funding stage.
I also used window functions to calculate rolling totals and rank companies based on layoffs.
This helped me practice identifying patterns and understanding workforce reduction trends.
MySQL
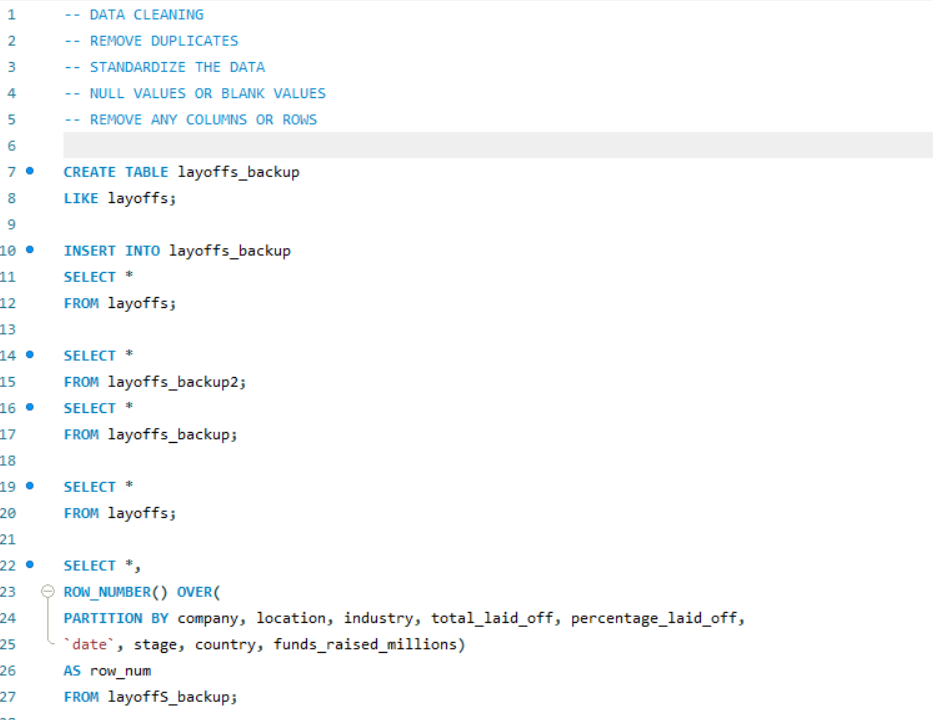
Data Cleaning – Layoff Dataset
I focused on cleaning messy data using SQL. I created a backup table to preserve raw data,
removed duplicates, converted text-based dates into proper date formats, filled missing
values using self-joins, and filtered incomplete records. This ensured the dataset was
accurate and reliable for analysis.